I’ve spent many days lamenting the difficulty of getting good weather information aboard using the simple equipment available on a typical coastal cruiser using a smartphone and VHF radio. On the west coast of Canada, we’re spoiled by the high quality of Environment Canada’s marine forecast. They tend to overstate the wind which can lead to occasional disappointment in the sailing department, but generally speaking, the forecasts are good at predicting wind direction, wind shift timing and precipitation. I like to know whats happening under the hood though, and Environment Canada’s synopsis is limited in the geographical extent westward, time frame and detail. In short, I want more information.
Synoptic Charts
I get a perverse joy out of looking at a surface level synoptic chart and guessing what will happen based on the information presented, and I’m very curious about the black art of using 500mb charts as an advanced tool for weather prediction. Unfortunately, I’ve had trouble finding easy to read and easy to find charts on both Environment Canada’s and NOAA’s websites, and I’ve spent quite a bit of time looking.
All that changed when I stumbled upon David Burch’s excellent website starpath.com. There is tons of stuff on his site – it’s a bit of a rabbit hole of weather information goodness – but for now, this link is my favorite: https://www.starpath.com/downloads/PacificBriefing.pdf. This pdf has links to a variety of commonly used charts, each with two ways to download the image. Because it is a pdf, the document can be downloaded and viewed without using bandwidth. The links work when viewed in Acrobat, meaning that the only data you’ll use is the download of the actual chart.
The first way to download a chart is to click on the “download from internet” button; the second way is to request it from Saildocs. Saildocs is a free service, and will email you smaller version of the same image. The advantage of using the Saildocs service is the smaller file size. The images themselves are tif files and are viewable in any image viewer.
GRIB Files.
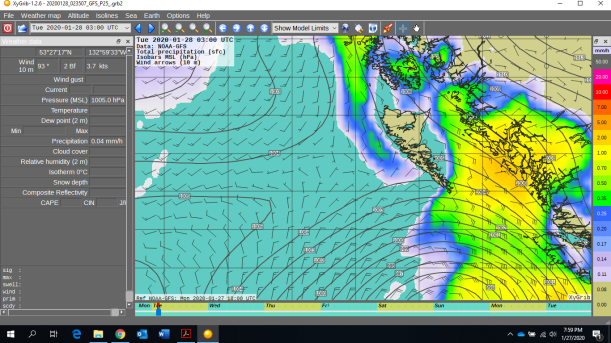
GRIB stands for Gridded Information in Binary, and is the unedited output from a computer using data and an algorithm to create a model of the weather. These files are the basis for the output from apps like WindyTY and PredictWind. Both of these apps are very powerful, with excellent graphics that show a variety of forecast weather conditions such as sustained wind strength, gust strength, precipitation and sea state. For those interested in getting this data on your computer, you can download a GRIB viewer such as Xygrib. Xygrib is super easy to use, with menus to choose the data you’d like to download and see. The download dialog box tells you the file size before you click download so that you can make informed choice when download speed or bandwidth are issues.
There are a couple of important things to know about GRIB files. Foremost is the fact that the data you’re seeing is untouched by human expertise – the viewers make the data look very official and comprehensive, but quality of the forecast model is totally dependent on the algorithm and the data going into it. There are a number of models available, and they will all give you a different picture. Unfortunately, not all models are available on Xygrib for free.
When using GRIBs to help with your decision making, there are a couple of things you can do to gauge the veracity of the forecast: watch for changes in a single model forecast over time. A long range forecast that changes little as the day(s) in question approaches suggests a higher confidence in that forecast. You should also look at a couple of different models – a consistency between models generally implies that you can have more confidence in the forecast.
Text Forecasts
Text forecasts are the same forecasts that are broadcast over the radio. Not only is having the information in a readable format much easier to digest than listening, the government sites offer a ton of other useful resources that we use constantly. Our favorite feature on Environment Canada’s site is the 24 hour history for all of the available weather reporting stations. We feel that historical data is critical when making important go / no-go decisions because it allows us to spot trends and assess current accuracy by comparing forecasts to actual conditions over time. Lastly, like synoptic charts, forecasts produced by meteorological offices are created by weather professionals using a variety of data sources. Text Forecasts for Canada are available at: https://weather.gc.ca/marine/index_e.html. Text forecasts for the US are available at www.weather.gov/marine/.
Putting It All Together
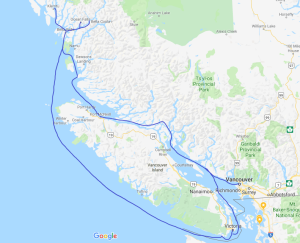
When we sailed non-stop down the west coast of Vancouver Island last year, PredictWind and Windy both forecast NW winds to 20kt. The Environment Canada forecast called for 25 -30kts. All three sources predicted a 3 day window between low pressure systems and their associated SE winds. We saw 30 gusting 35 for about 6 hours. There is a huge difference between sailing in 20 and 30 kts, but we were mentally and physically prepared for the conditions we experienced. The bottom line is that predictions are predictions, not promises. GRIBs and their associated viewing platforms are are awesome and easy to use, but they are not infallible. Neither is the weatherman. Use multiple data sources and be prepared for them all to be wrong.
Do you have other resources that you find helpful? Did you find this information useful? Please leave a comment. Thanks and fair winds!